

A robust and Efficient FRET-Based Assay for Cannabinoid Receptor Ligands Discovery.
- Lucía from Celtarys Research

- Jun 25, 2025
- 11 min read
Updated: Aug 25, 2025
1. Introduction
1.1 The Endocannabinoid System
The Endocannabinoid System (ECS) is composed of the Cannabinoid Receptors 1 and 2 (CB1R and CB2R) and the endocannabinoids (endogenous ligands such as 2-arachidonoylglycerol and anandamide) as well as metabolic enzymes.
It is involved in several pathophysiological processes such as Parkinson’s disease, depression, addiction, eating disorders and has synergistic effects with anticancer agents.[1–3] These insights highlight the potential in modulating the ECS to fulfill unmet medical needs. New scaffolds modulating the CBRs in both the orthosteric and allosteric sites have been developed, supported by resolved crystal structures of both CBRs.[4–8]
A key challenge in CBR modulator development is separating the therapeutic effects from the side effects, especially the psychotropic effects CB1R causes in the Central Nervous System. This can be appreciated when talking about SCRAs (Synthetic Cannabinoid Agonists), as one of the series developed by Pfizer, including CP5594, gave rise to a new class of abused psychoactive substances, thanks to their higher potency in the CB1R. [9,10]
1.2 Novel fluorescent strategies for CBR binding affinity assays
Thus, the need for novel, robust and cost-effective methodologies for screening compound libraries targeting the CBRs becomes key for identifying drugs with a clinical profile. The most used probe right now is the radioactive CP-55940, [3H-CP-55940].[11]
![Figure 1. Chemical structure of [3H-CP-55940].](https://static.wixstatic.com/media/19e09b_8c5befd4db2c4609baa349f72f46b8f7~mv2.jpg/v1/fill/w_258,h_153,al_c,q_80,enc_avif,quality_auto/19e09b_8c5befd4db2c4609baa349f72f46b8f7~mv2.jpg)
Selective fluorescent CB1R ligands have been validated for flow cytometry [12], and selective CB2R probes have been validates in TR-FRET[13], as well as receptor visualization in living cells[14], mice[15], and zebrafish[13].
Homogeneous Time-Resolved Fluorescence (HTRF) is a TR-FRET-based assay[16] conducted in homogeneous conditions, using lanthanide (europium, terbium) as donors.[17] Lanthanides provide unique advantages as donors, since they have extended fluorescence duration, enable delayed emission readings, have narrow bands and high stokes shift, which prevent cross-excitation and cross-emission phenomena.[18] Thus, they reduce background noise, improving both the signal-to-noise ratio and the sensitivity of the assays. [18–20]
Several strategies can be used to attach donor fluorophores to the target, among them antibodies bearing the donor. GPCRs are not suitable for antibody use due to steric hindrance and reverse binding, thus, other strategies must be applied. Among them, we have chosen the SNAP-tag, a suicide enzyme technology. The SNAP-tag is an engineered mutant of O5-alkylguanine-DNA alkyltransferase (AGT) that reacts specifically with O6-benzylguanine (BG) derivatives. This modification is small enough to not affect GPCR expression or activity.[21–23]
The Tag-lite® binding assay combines the HTRF detection method with the SNAP-tag. It has been applied to different GPCR binding assays, such as CXCR4, opioid receptors, CCK1 and CCK2. We have previously used this technology using CELT-335, a dual hCB1/hCB2 fluorescent ligand, which was validated in CB1R as a binding assay probe with three natural CBR ligands.
Herein we report the first example of a Tag-lite® binding assay for both CBs using CELT-335, which exhibits a high specific binding (signal-to-noise ratio), and FERT signal, providing a reliable, robust and cost-effective alternative for CB1R and CB2R screening campaigns.[24]
2. Results
2.1 CELT-335 Binding at CB1 and CB2 Receptors
The first step for the development of the assay is to obtain a fluorescent ligand suitable for the Tag-lite® binding assays. In this case, CELT-335 exhibits exc and em at 650nm and 673nm, which are compatible with the lanthanide Terbium.
Their binding affinity was assessed through radioligand binding, showing a nanomolar affinity for both CBRs, with it being 6-fold higher for CB2R.

Table 1. Comparison of CELT-335 affinity for CB1 and CB2 receptors measured by competition radioligand binding assay (Ki) and saturation Tag-lite® binding assay (Kd). 1 Competition radioligand binding assay. 2 Saturation assay by Tag-lite® binding assay. 3 Displacement of specific [3H]-CP55940 binding in human HEK-CB1 cells expressed as Ki ± SEM in nM (n = 3) or percentage displacement of specific binding at a concentration of 1 μM (n = 2). 4 Displacement of specific [3H]-CP55940 binding in human HEK-CB2 cells expressed as pKi ± SEM in nM (n = 3) or percentage displacement of specific binding at a concentration of 1 μM (n = 2). 5 pKd calculated through saturation of CELT-335 in human HEK-293T cells transiently expressing Tb-labeled SNAP-CB1R. 6 Kd calculated through saturation of CELT-335 in human HEK-293T cells transiently expressing Tb-labeled SNAP-CB2R.
In the saturation experiments, specific binding was also checked, employing appropriate competitors (Figure 2). The high affinity of CELT-335 for CB1R was maintained in the Tag-lite® assay (Ki=44.8nM in radioligand assay and Kd= 42nM in Tag-lite®).

2.2 CELT-335 HTRF assay validation in hCB1R Expressing adherent Cells.
To validate the potential of CELT-335 as a probe, seven reference compounds were selected.
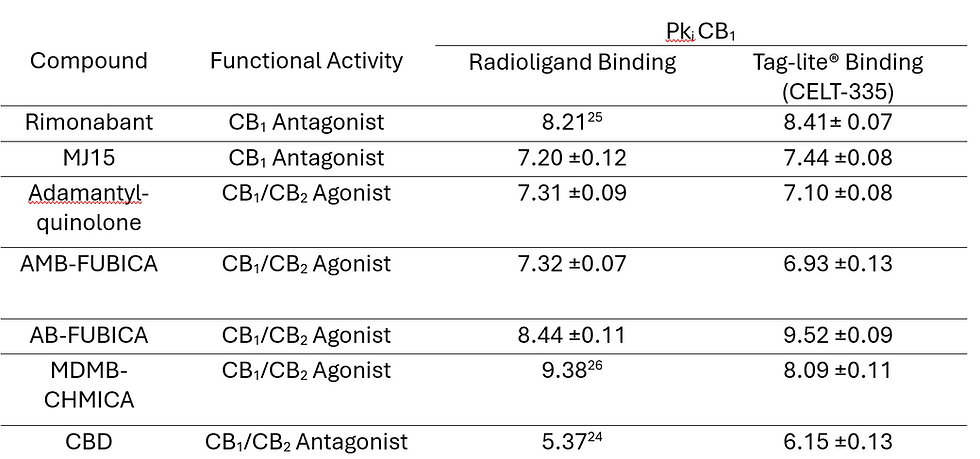
Table 2. Comparison of affinity data for CB1 receptor of the set of reference compounds obtained through the radioligand competition binding assay and CB1 competition binding assays with Tag-lite® technology using CELT-335. Values represent the mean ± SEM of triplicate determinations. Reference is not indicated for those compounds whose affinity through the radioligand binding assay was measured experimentally following published protocols.[14]

Using these results as a starting point, the Tag-lite® binding assay was developed. In Figure 4 coherent and well-defined sigmoidal concentration/response curves can be found for all seven molecules tested, and their pKi values compared to literature data in Table 2.

2.3 CELT-335 HTRF Assay Validation in hCB2R Expresing adherent cells
The Kd obtained through the Tag-lite® saturation binding assay at the CB2R is 24.2nM, confirming the one observed in radioligand assay, while maintaining the appropriate properties for the HTRF signal. Thus, the same set of compounds used for CB1R competition assays was used in CB2R.

Table 3. Comparison of affinity data for CB1 receptor of the set of reference compounds obtained through the radioligand competition binding assay and CB1 competition binding assays with Tag-lite® technology using CELT-335. Values represent the mean ±SEM of triplicate determinations. Reference is not indicated for those compounds whose affinity through the radioligand binding assay was measured experimentally following published protocols.[14]

3. Discussion
The saturation experiments revealed a lower 2-fold difference in the Kd for each CBR receptor, which was originally 6-fold in the radioligand binding assays, while keeping an excellent FRET signal. High specific binding was observed by measuring 10uM concentrations of the appropriate competitors (CP55490 and GW405833 for CB1R and CB2R).
To fully optimize the Tag-lite assays, the concentration of probe was based on the Kd obtained for each receptor, 100nM for CB1R and 10nM for CB2R. The curves obtained using this concentration of probe in the Tag-lite® assays are reproducible sigmoidal concentratio/response curves and the affinity data obtained (Ki) has a high correlation to those obtained through tradional radioligand binding assays.
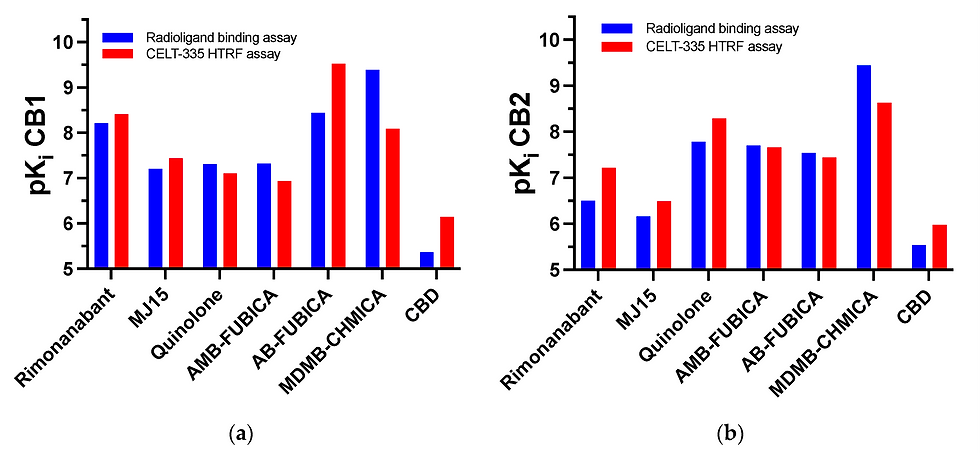
The set of reference compounds were chosen to provide the highest diversification in affinity, selectivity, functional acitvity and chemical structure. A graphic highlighting these differences can be found in Figure 7.

CELT-335 proved itself as a good competitor for both synthetic and naturally derived cannabinoid ligands, both agonists and antagonists. It highlights the difference in affinity of compounds such as SCRAs and other synthetic cannabinoids. Furthermore, the affinity trend is similar to those obtained in literature and traditional radioligand binding assays. Indeed, the difference is lower than 1pKi value between both experiments. For further validation, a larger range of compounds will be tested, including screening chemical libraries with even more diversity in chemical structures and affinities for other receptors.
If you want to read the materials and methods section check out the link to the full article.
If you have any questions about CELT-335 or the assays themselves, feel free to contact me!
References
(1) Ajalin, R. M.; Al‐Abdulrasul, H.; Tuisku, J. M.; Hirvonen, J. E. S.; Vahlberg, T.; Lahdenpohja, S.; Rinne, J. O.; Brück, A. E. Cannabinoid Receptor Type 1 in Parkinson’s Disease: A Positron Emission Tomography Study with [ 18 F ] FMPEP ‐ d2. Movement Disorders 2022, 37 (8), 1673–1682. https://doi.org/10.1002/mds.29117.
(2) Kibret, B. G.; Ishiguro, H.; Horiuchi, Y.; Onaivi, E. S. New Insights and Potential Therapeutic Targeting of CB2 Cannabinoid Receptors in CNS Disorders. IJMS 2022, 23 (2), 975. https://doi.org/10.3390/ijms23020975.
(3) Hinz, B.; Ramer, R. Cannabinoids as Anticancer Drugs: Current Status of Preclinical Research. Br J Cancer 2022, 127 (1), 1–13. https://doi.org/10.1038/s41416-022-01727-4.
(4) Hua, T.; Vemuri, K.; Pu, M.; Qu, L.; Han, G. W.; Wu, Y.; Zhao, S.; Shui, W.; Li, S.; Korde, A.; Laprairie, R. B.; Stahl, E. L.; Ho, J.-H.; Zvonok, N.; Zhou, H.; Kufareva, I.; Wu, B.; Zhao, Q.; Hanson, M. A.; Bohn, L. M.; Makriyannis, A.; Stevens, R. C.; Liu, Z.-J. Crystal Structure of the Human Cannabinoid Receptor CB1. Cell 2016, 167 (3), 750-762.e14. https://doi.org/10.1016/j.cell.2016.10.004.
(5) Li, X.; Hua, T.; Vemuri, K.; Ho, J.-H.; Wu, Y.; Wu, L.; Popov, P.; Benchama, O.; Zvonok, N.; Locke, K.; Qu, L.; Han, G. W.; Iyer, M. R.; Cinar, R.; Coffey, N. J.; Wang, J.; Wu, M.; Katritch, V.; Zhao, S.; Kunos, G.; Bohn, L. M.; Makriyannis, A.; Stevens, R. C.; Liu, Z.-J. Crystal Structure of the Human Cannabinoid Receptor CB2. Cell 2019, 176 (3), 459-467.e13. https://doi.org/10.1016/j.cell.2018.12.011.
(6) An, D.; Peigneur, S.; Hendrickx, L. A.; Tytgat, J. Targeting Cannabinoid Receptors: Current Status and Prospects of Natural Products. IJMS 2020, 21 (14), 5064. https://doi.org/10.3390/ijms21145064.
(7) Lu, D.; Immadi, S. S.; Wu, Z.; Kendall, D. A. Translational Potential of Allosteric Modulators Targeting the Cannabinoid CB1 Receptor. Acta Pharmacol Sin 2019, 40 (3), 324–335. https://doi.org/10.1038/s41401-018-0164-x.
(8) Gado, F.; Di Cesare Mannelli, L.; Lucarini, E.; Bertini, S.; Cappelli, E.; Digiacomo, M.; Stevenson, L. A.; Macchia, M.; Tuccinardi, T.; Ghelardini, C.; Pertwee, R. G.; Manera, C. Identification of the First Synthetic Allosteric Modulator of the CB2 Receptors and Evidence of Its Efficacy for Neuropathic Pain Relief. J. Med. Chem. 2019, 62 (1), 276–287. https://doi.org/10.1021/acs.jmedchem.8b00368.
(9) Adams, A. J.; Banister, S. D.; Irizarry, L.; Trecki, J.; Schwartz, M.; Gerona, R. “Zombie” Outbreak Caused by the Synthetic Cannabinoid AMB-FUBINACA in New York. N Engl J Med 2017, 376 (3), 235–242. https://doi.org/10.1056/NEJMoa1610300.
(10) Rosado, T.; Gonçalves ,Joana; Luís ,Ângelo; Malaca ,Sara; Soares ,Sofia; Vieira ,Duarte Nuno; Barroso ,Mário; and Gallardo, E. Synthetic Cannabinoids in Biological Specimens: A Review of Current Analytical Methods and Sample Preparation Techniques. Bioanalysis 2018, 10 (19), 1609–1623. https://doi.org/10.4155/bio-2018-0150.
(11) Showalter, V. M.; Compton, D. R.; Martin, B. R.; Abood, M. E. Evaluation of Binding in a Transfected Cell Line Expressing a Peripheral Cannabinoid Receptor (CB2): Identification of Cannabinoid Receptor Subtype Selective Ligands. J Pharmacol Exp Ther 1996, 278 (3), 989–999.
(12) Martín-Fontecha, M.; Angelina, A.; Rückert, B.; Rueda-Zubiaurre, A.; Martín-Cruz, L.; Van De Veen, W.; Akdis, M.; Ortega-Gutiérrez, S.; López-Rodríguez, M. L.; Akdis, C. A.; Palomares, O. A Fluorescent Probe to Unravel Functional Features of Cannabinoid Receptor CB1 in Human Blood and Tonsil Immune System Cells. Bioconjugate Chem. 2018, 29 (2), 382–389. https://doi.org/10.1021/acs.bioconjchem.7b00680.
(13) Gazzi, T.; Brennecke, B.; Atz, K.; Korn, C.; Sykes, D.; Forn-Cuni, G.; Pfaff, P.; Sarott, R. C.; Westphal, M. V.; Mostinski, Y.; Mach, L.; Wasinska-Kalwa, M.; Weise, M.; Hoare, B. L.; Miljuš, T.; Mexi, M.; Roth, N.; Koers, E. J.; Guba, W.; Alker, A.; Rufer, A. C.; Kusznir, E. A.; Huber, S.; Raposo, C.; Zirwes, E. A.; Osterwald, A.; Pavlovic, A.; Moes, S.; Beck, J.; Nettekoven, M.; Benito-Cuesta, I.; Grande, T.; Drawnel, F.; Widmer, G.; Holzer, D.; Van Der Wel, T.; Mandhair, H.; Honer, M.; Fingerle, J.; Scheffel, J.; Broichhagen, J.; Gawrisch, K.; Romero, J.; Hillard, C. J.; Varga, Z. V.; Van Der Stelt, M.; Pacher, P.; Gertsch, J.; Ullmer, C.; McCormick, P. J.; Oddi, S.; Spaink, H. P.; Maccarrone, M.; Veprintsev, D. B.; Carreira, E. M.; Grether, U.; Nazaré, M. Detection of Cannabinoid Receptor Type 2 in Native Cells and Zebrafish with a Highly Potent, Cell-Permeable Fluorescent Probe. Chem. Sci. 2022, 13 (19), 5539–5545. https://doi.org/10.1039/D1SC06659E.
(14) Spinelli, F.; Giampietro, R.; Stefanachi, A.; Riganti, C.; Kopecka, J.; Abatematteo, F. S.; Leonetti, F.; Colabufo, N. A.; Mangiatordi, G. F.; Nicolotti, O.; Perrone, M. G.; Brea, J.; Loza, M. I.; Infantino, V.; Abate, C.; Contino, M. Design and Synthesis of Fluorescent Ligands for the Detection of Cannabinoid Type 2 Receptor (CB2R). European Journal of Medicinal Chemistry 2020, 188, 112037. https://doi.org/10.1016/j.ejmech.2020.112037.
(15) Zhang, S.; Shao, P.; Bai, M. In Vivo Type 2 Cannabinoid Receptor-Targeted Tumor Optical Imaging Using a Near Infrared Fluorescent Probe. Bioconjugate Chem. 2013, 24 (11), 1907–1916. https://doi.org/10.1021/bc400328m.
(16) Morrison, L. E. Time-Resolved Detection of Energy Transfer: Theory and Application to Immunoassays. Analytical Biochemistry 1988, 174 (1), 101–120. https://doi.org/10.1016/0003-2697(88)90524-6.
(17) Mathis, G. Probing Molecular Interactions with Homogeneous Techniques Based on Rare Earth Cryptates and Fluorescence Energy Transfer. Clinical Chemistry 1995, 41 (9), 1391–1397. https://doi.org/10.1093/clinchem/41.9.1391.
(18) Selvin, P. R. Principles and Biophysical Applications of Lanthanide-Based Probes. Annual Review of Biophysics, 2002, 31, 275–302. https://doi.org/10.1146/annurev.biophys.31.101101.140927.
(19) Barnoin, G.; Shaya, J.; Richert, L.; Le, H.-N.; Vincent, S.; Guérineau, V.; Mély, Y.; Michel, B. Y.; Burger, A. Intermolecular Dark Resonance Energy Transfer (DRET): Upgrading Fluorogenic DNA Sensing. Nucleic Acids Research 2021, 49 (12), e72–e72. https://doi.org/10.1093/nar/gkab237.
(20) Degorce, F. HTRF: A Technology Tailored for Drug Discovery - A Review of Theoretical Aspects and Recent Applications. TOCHGENJ 2009, 3 (1), 22–32. https://doi.org/10.2174/1875397300903010022.
(21) Gronemeyer, T.; Chidley, C.; Juillerat, A.; Heinis, C.; Johnsson, K. Directed Evolution of O6-Alkylguanine-DNA Alkyltransferase for Applications in Protein Labeling. Protein Engineering Design and Selection 2006, 19 (7), 309–316. https://doi.org/10.1093/protein/gzl014.
(22) Maurel, D.; Comps-Agrar, L.; Brock, C.; Rives, M.-L.; Bourrier, E.; Ayoub, M. A.; Bazin, H.; Tinel, N.; Durroux, T.; Prézeau, L.; Trinquet, E.; Pin, J.-P. Cell-Surface Protein-Protein Interaction Analysis with Time-Resolved FRET and Snap-Tag Technologies: Application to GPCR Oligomerization. Nature Methods 2008, 5 (6), 561–567. https://doi.org/10.1038/nmeth.1213.
(23) Keppler, A.; Gendreizig, S.; Gronemeyer, T.; Pick, H.; Vogel, H.; Johnsson, K. A General Method for the Covalent Labeling of Fusion Proteins with Small Molecules in Vivo. Nature Biotechnology 2003, 21 (1), 86–89. https://doi.org/10.1038/nbt765.
(24) Zwier, J. M.; Roux, T.; Cottet, M.; Durroux, T.; Douzon, S.; Bdioui, S.; Gregor, N.; Bourrier, E.; Oueslati, N.; Nicolas, L.; Tinel, N.; Boisseau, C.; Yverneau, P.; Charrier-Savournin, F.; Fink, M.; Trinquet, E. A Fluorescent Ligand-Binding Alternative Using Tag-Lite® Technology. SLAS Discovery 2010, 15 (10), 1248–1259. https://doi.org/10.1177/1087057110384611.
(25) Fulp, A.; Zhang, Y.; Bortoff, K.; Seltzman, H.; Snyder, R.; Wiethe, R.; Amato, G.; Maitra, R. Pyrazole Antagonists of the CB1 Receptor with Reduced Brain Penetration. Bioorganic & Medicinal Chemistry 2016, 24 (5), 1063–1070. https://doi.org/10.1016/j.bmc.2016.01.033.
(26) Schoeder, C. T.; Hess, C.; Madea, B.; Meiler, J.; Müller, C. E. Pharmacological Evaluation of New Constituents of “Spice”: Synthetic Cannabinoids Based on Indole, Indazole, Benzimidazole and Carbazole Scaffolds. Forensic Toxicol 2018, 36 (2), 385–403. https://doi.org/10.1007/s11419-018-0415-z.
(27) Stern, E.; Muccioli, G. G.; Millet, R.; Goossens, J.-F.; Farce, A.; Chavatte, P.; Poupaert, J. H.; Lambert, D. M.; Depreux, P.; Hénichart, J.-P. Novel 4-Oxo-1,4-Dihydroquinoline-3-Carboxamide Derivatives as New CB2 Cannabinoid Receptors Agonists: Synthesis, Pharmacological Properties and Molecular Modeling. J. Med. Chem. 2006, 49 (1), 70–79. https://doi.org/10.1021/jm050467q.


Comments