

Fluorescence based HTS compatible ligand binding assays for dopamine D3 receptors in baculovirus preparations and live cells
- Lucía from Celtarys Research

- May 29, 2025
- 11 min read
Updated: Aug 25, 2025
1. Introduction
Dopamine receptors are G-protein-coupled receptors (GPCRs), which have 5 subtypes -D1-5. The dysfunction of these receptors has been linked to the development of many serious pathologies, like depression, schizophrenia and Parkinson’s disease. [1,2] Several dopamine ligands have been approved as drugs, however they often have serious side effects and too low or temporary therapeutic effects.[3,4] Since dopaminergic signaling is very complex, there’s a need to increase and modernize the assays to study this system. Thus, developing assays for commercially available probes such as CELT-419 would facilitate research into these receptors.
Understanding binding kinetics is a key step for a more mechanistic and systematic understanding of the ligands’ action. Thus, fluorescence polarization assays and other fluorescence-based methods that allow for kinetic measurements should reduce this knowledge gap. Fluorescence anisotropy (FA) assay has been used to study the ligand binding kinetics of many GPCRs.[5–7]
2. Fluorescence Anisotropy and BBV – The theory behind the assays
FA is based on measuring the change in rotational freedom of the fluorescent label upon receptor binding, thus does not require the physical separation of the bound and free ligand. Moreover, due to the ratiometric nature of the assay, the FA signal depends on the concentration of both the free and the receptor-bound fluorescent ligand. Therefore, FA requires sufficient receptor concentration to achieve free achieve depletion of free fluorescent ligand.
Budded baculoviruses (BBV) have a high receptor concentration as well as being homogenous in size, which makes them a good receptor source for a FA assay.8 It must be considered that the BBVs are nanoparticles covered with Sf9 cell membranes different from mammalian membranes,[9] which can affect receptors’ properties.[10,11] BBVs also lack downstream signaling components, which can be an advantage or disadvantage depending on the purpose of the assay. Thus, in order to complete the studies, quantitative live cell microscopy assay relies on cell segmentation from the bright-field channel while quantifying ligand binding from the fluorescent channel.[7]
3. Probe characterization and assay development and validation
3.1 Characterization of CELT-419 in radioligand binding assay
To determine the affinity CELT-419 has for D3R, and prove it has enough affinity for FA assays, the radioligand binding method was used. The IC50 ± SEM value for CELT-419 binding to D3 receptor was determined to be 30.1 ± 1.7 nM corresponding to apparent Ki ± SEM = 15.7 ± 0.9 nM according to the Cheng-Prusoff model.[12] However, CELT-419 binds also to the D2 receptor in a similar affinity range (IC50 ± SEM = 78 ± 6 nM; Ki ± SEM = 44 ± 3 nM), while the affinity to D4 receptor is significantly worse (12% displacement at 10 μM).
3.2 Kinetic and equilibrium properties of CELT-419 to D3R in BBVs
FA assay, the ligand must have a suitable fluorescent label to obtain good-quality results. The possibility to monitor the process kinetics is useful from multiple points of view – practically, it can be used to determine the time to reach equilibrium and, more fundamentally, to determine the kinetic parameters of the ligand binding.
Using the FA method, CELT-419 binding affinity and kinetics were determined using budded baculovirus particles (BBV) that display the D3 receptors on their membrane. Figure 1 shows that CELT-419 binds reversibly to the D3 receptor, and there is a large difference between total and non-specific binding resulting in a high signal-to-noise-ratio and stable signal over several hours.

The model obtained by global analysis of kinetic data suggests that 8 ± 4% of CELT-419 is non-specifically bound. Saturation binding experiments with high-quality results (Figure 2) enabled the calculation of the binding affinity constant Kd ± SEM of 0.42 ± 0.04 nM and receptor concentration in the BBV stock preparation Rstock ± SEM of 20 ± 4 nM.

3.3 FA competition binding assay with BBVs
CELT-419 has the properties required for measuring affinities of unlabeled ligands: good affinity, high signal-to-noise ratio and stable FA signal during its binding to the D3Rs present in the BBVs. The speed of reaching the binding equilibrium is key for this assay, which can be monitored over time until the values stabilize.
To validate that the developed assay is suitable for measuring the Ki of different ligands, competition binding measurements were carried out using CELT-419. The assay shows a high signal level with DELTAFA+-SD between total and non-specific points of 0.12+-0.02 (n=26) anisotropy units. The estimated Z’ of the assay is 0.71, which is sufficient for HTS standards.

The Ki values were calculated based on the IC50 values, receptor concentration and Kd of CELT-419 as described in Veiksina et al., 2014, considering the ligand depletion effect during FA assay. Overall the determined affinities agree well with the affinities from previous studies.[13]
Besides traditional dopaminergic ligands, the affinities of the P-165 (CELT-419 pharmacophore), and PL-384 (pharmacophore + linker of CELT-419), were also determined to understand any effects the fluorescent moiety may have on the binding properties of the ligand. No substantial differences were found between them and the reporter.
![Figure 4. Displacement of CELT-419 binding to D3 receptor by different dopaminergic ligands. Change in FA level was measured after incubation of 0.5 nM CELT-419, 1 μL BBV/well (CD3R = 0.7 nM), and different concentrations of corresponding dopaminergic ligands for 180 min. The FA values were normalized by taking the average FA value of C = 0 points as 100% and the average FA value of the highest used concentration points as 0%. Data of a representative experiment from at least three independent experiments, performed in duplicates, is shown with both replicates displayed. pKi values are calculated as described in Veiksina et al., 2014, and presented as mean ± SD of n independent experiments.[13]](https://static.wixstatic.com/media/19e09b_ada10a009df14fc1bbb4f4ba90d49d4d~mv2.jpg/v1/fill/w_567,h_221,al_c,q_80,enc_avif,quality_auto/19e09b_ada10a009df14fc1bbb4f4ba90d49d4d~mv2.jpg)
Due to the relatively slow kinetics of PL-384 compared to CELT-419 (Figure 3B), it was possible to determine the kinetic parameters of PL-384 binding to D3 receptors from competition binding experiment data by global systems biology analysis (Figure 5). The results suggest that adding the linker to the pharmacophore slows down both association and dissociation kinetics, but further addition of the fluorescent label to the structure does not have any further effects. Altogether, these aspects hint that the linker design and strategy can provide options for the tuning of the final ligand’s kinetic properties.
Miniaturization is key for HTS application, so achieving good Z’ values for GPCR ligand binding assays using a 384-well plate. In this case, the Z’ value is high enough, proving that the change does not deteriorate the assay during the 3-5h experiments performed.
3.4 Quantitative live-cell microscopy with CELT-419
New robust fluorescent ligands and sophisticated microscopy systems have opened possibilities to perform more high-quality and automated measurements and, therefore, allows HTS compatible quantitative ligand binding experiments in live cells.
Since BBVs lack downstream signaling, doing a quantitative lice-cell assay using the same ligand would provide more information and alternatives for binding assays.
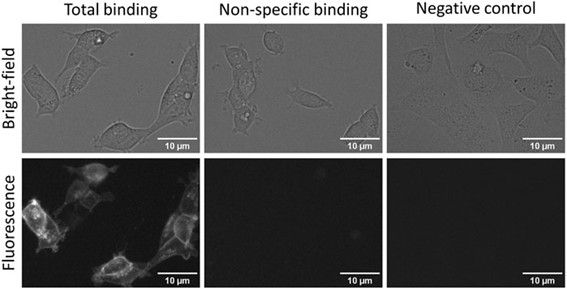
Therefore, CELT-419, which worked well in FA assays, was also tested with live HEK293-D3R cells. CELT-419 binding to D3 receptors in cells can be clearly visualized with fluorescence imaging. The signal is highly specific as no binding can be seen in the presence of 10 μM Spiperone nor in cells not expressing the D3 receptor.
CELT-419 localizes mainly to the cell contour corresponding to receptor-ligand binding in cell membranes. These results indicate that CELT-419 is suitable for live-cell assay with automated microscopy.
As the next step, the cells were incubated with different concentrations of CELT-419 to determine its affinity for D3 receptors in a live cell system. The Kd ± SEM of 0.38 ± 0.14 nM determined from the saturation binding curve (Figure 7) is in good agreement with the affinity obtained from the FA assay.

Also, competition experiments were carried out to demonstrate the versatility of this system (Figure 8) Dopamine (agonist) as well as Spiperone (antagonist) caused concentration-dependent displacement of CELT-419 to live HEK293-D3R cells. The affinities of these ligands in live cells were higher than in FA assay, but this can be caused by difference in cell membrane composition and downstream signaling systems of the targets. As it is shown before dopamine receptors ligands can achieve higher affinity if G-proteins are coupled to the receptor.[14]

4. Conclusions and future perspective
As can be seen from all the data from this study, CELT-419 is a high-affinity ligand with good kinetic properties, which showed similar results both in FA assay with BBVs and quantitative live-cell fluorescence microscopy. Therefore, both assays can be used for fundamental D3 receptor-ligand binding studies as well as for drug screening purposes. The use of CELT-419 as a fluorescent ligand is not limited by the methods used in this study. Several fluorescence ligands that performed well in either FA or live-cell assays have been confirmed to work well also, for example, in both live-cell and BBVbased TIRF microscopy assays, nanoBRET method and flow cytometry. 15–17In addition, this ligand may be suitable for some superresolution microscopy methods such as photoactivated localization microscopy (PALM) or other single-molecule localization microscopy (SMLM). 18,19However, the Cy3B label of CELT-419, which fits well for FA and live-cell microscopy measurements, is not the best choice for all assays. For example, some assays benefit from using a more red-shifted fluorescent label or a combination of multiple labels in a single study. For example, a Cy5-labelled fluorescent ligand with the same pharmacophore is available from Celtarys Research (CELT-241) which may be more suitable for tissue labelling and imagining due to lower autofluorescence. Altogether, the development of similar probes for other GPCRs and further development of measurement methods can increase the quality and quantity of both fundamental receptor research and high-throughput drug screening.
If you are curious about the material and methods or want more information, here is the published article: Frontiers | Fluorescence based HTS-compatible ligand binding assays for dopamine D3 receptors in baculovirus preparations and live cells
References
(1) Leggio, G. M.; Bucolo, C.; Platania, C. B. M.; Salomone, S.; Drago, F. Current Drug Treatments Targeting Dopamine D3 Receptor. Pharmacology & Therapeutics 2016, 165, 164–177. https://doi.org/10.1016/j.pharmthera.2016.06.007.
(2) Sokoloff, P.; Le Foll, B. The Dopamine D3 Receptor, a Quarter Century Later. Eur J of Neuroscience 2017, 45 (1), 2–19. https://doi.org/10.1111/ejn.13390.
(3) Borovac, J. A. Side Effects of a Dopamine Agonist Therapy for Parkinson’s Disease: A Mini-Review of Clinical Pharmacology. 2006.
(4) Garcia-Borreguero, D.; Silber, M. H.; Winkelman, J. W.; Högl, B.; Bainbridge, J.; Buchfuhrer, M.; Hadjigeorgiou, G.; Inoue, Y.; Manconi, M.; Oertel, W.; Ondo, W.; Winkelmann, J.; Allen, R. P. Guidelines for the First-Line Treatment of Restless Legs Syndrome/Willis–Ekbom Disease, Prevention and Treatment of Dopaminergic Augmentation: A Combined Task Force of the IRLSSG, EURLSSG, and the RLS-Foundation. Sleep Medicine 2016, 21, 1–11. https://doi.org/10.1016/j.sleep.2016.01.017.
(5) Tõntson, L.; Kopanchuk, S.; Rinken, A. Characterization of 5-HT1A Receptors and Their Complexes with G-Proteins in Budded Baculovirus Particles Using Fluorescence Anisotropy of Bodipy-FL-NAN-190. Neurochemistry International 2014, 67, 32–38. https://doi.org/10.1016/j.neuint.2014.01.012.
(6) Link, R.; Veiksina, S.; Rinken, A.; Kopanchuk, S. Characterization of Ligand Binding to Melanocortin 4 Receptors Using Fluorescent Peptides with Improved Kinetic Properties. European Journal of Pharmacology 2017, 799, 58–66. https://doi.org/10.1016/j.ejphar.2017.01.040.
(7) Allikalt, A.; Kopanchuk, S.; Rinken, A. Implementation of Fluorescence Anisotropy-Based Assay for the Characterization of Ligand Binding to Dopamine D1 Receptors. European Journal of Pharmacology 2018, 839, 40–46. https://doi.org/10.1016/j.ejphar.2018.09.008.
(8) Rinken, A.; Lavogina, D.; Kopanchuk, S. Assays with Detection of Fluorescence Anisotropy: Challenges and Possibilities for Characterizing Ligand Binding to GPCRs. Trends in Pharmacological Sciences 2018, 39 (2), 187–199. https://doi.org/10.1016/j.tips.2017.10.004.
(9) Marheineke, K.; Grünewald, S.; Christie, W.; Reiländer, H. Lipid Composition of Spodoptera Frugiperda (Sf9) and Trichoplusia Ni (Tn) Insect Cells Used for Baculovirus Infection. FEBS Letters 1998, 441 (1), 49–52. https://doi.org/10.1016/S0014-5793(98)01523-3.
(10) Harikumar, K. G.; Puri, V.; Singh, R. D.; Hanada, K.; Pagano, R. E.; Miller, L. J. Differential Effects of Modification of Membrane Cholesterol and Sphingolipids on the Conformation, Function, and Trafficking of the G Protein-Coupled Cholecystokinin Receptor. Journal of Biological Chemistry 2005, 280 (3), 2176–2185. https://doi.org/10.1074/jbc.M410385200.
(11) Mondal, S.; Khelashvili, G.; Johner, N.; Weinstein, H. How the Dynamic Properties and Functional Mechanisms of GPCRs Are Modulated by Their Coupling to the Membrane Environment. In G Protein-Coupled Receptors - Modeling and Simulation; Filizola, M., Ed.; Springer Netherlands: Dordrecht, 2014; pp 55–74. https://doi.org/10.1007/978-94-007-7423-0_4.
(12) Yung-Chi, C.; Prusoff, W. H. Relationship between the Inhibition Constant (KI) and the Concentration of Inhibitor Which Causes 50 per Cent Inhibition (I50) of an Enzymatic Reaction. Biochemical Pharmacology 1973, 22 (23), 3099–3108. https://doi.org/10.1016/0006-2952(73)90196-2.
(13) Veiksina, S.; Kopanchuk, S.; Rinken, A. Budded Baculoviruses as a Tool for a Homogeneous Fluorescence Anisotropy-Based Assay of Ligand Binding to G Protein-Coupled Receptors: The Case of Melanocortin 4 Receptors. Biochimica et Biophysica Acta (BBA) - Biomembranes 2014, 1838 (1), 372–381. https://doi.org/10.1016/j.bbamem.2013.09.015.
(14) Rinken, A.; Terasmaa, A.; Raidaru, G.; Fuxe, K. D2 Dopamine Receptor-G Protein Coupling. Cross-Regulation of Agonist and Guanosine Nucleotide Binding Sites. Neuroscience Letters 2001, 302 (1), 5–8. https://doi.org/10.1016/S0304-3940(01)01568-3.
(15) Grätz, L.; Tropmann, K.; Bresinsky, M.; Müller, C.; Bernhardt, G.; Pockes, S. OPEN NanoBRET Binding Assay. Scientific Reports.
(16) Laasfeld, T.; Ehrminger, R.; Tahk, M.-J.; Veiksina, S.; Kõlvart, K. R.; Min, M.; Kopanchuk, S.; Rinken, A. Budded Baculoviruses as a Receptor Display System to Quantify Ligand Binding with TIRF Microscopy. Nanoscale 2021, 13 (4), 2436–2447. https://doi.org/10.1039/D0NR06737G.
(17) Müller, C.; Gleixner, J.; Tahk, M.-J.; Kopanchuk, S.; Laasfeld, T.; Weinhart, M.; Schollmeyer, D.; Betschart, M. U.; Lüdeke, S.; Koch, P.; Rinken, A.; Keller, M. Structure-Based Design of High-Affinity Fluorescent Probes for the Neuropeptide Y Y1 Receptor. J. Med. Chem. 2022, 65 (6), 4832–4853. https://doi.org/10.1021/acs.jmedchem.1c02033.
(18) Dempsey, G. T.; Vaughan, J. C.; Chen, K. H.; Bates, M.; Zhuang, X. Evaluation of Fluorophores for Optimal Performance in Localization-Based Super-Resolution Imaging. Nature Methods 2011, 8 (12), 1027–1036. https://doi.org/10.1038/nmeth.1768.
(19) Schueder, F.; Stein, J.; Stehr, F.; Auer, A.; Sperl, B.; Strauss, M. T.; Schwille, P.; Jungmann, R. An Order of Magnitude Faster DNA-PAINT Imaging by Optimized Sequence Design and Buffer Conditions. Nature Methods 2019, 16 (11), 1101–1104. https://doi.org/10.1038/s41592-019-0584-7.


Comments